BarChart in Sketchware android project


1. Create a new project in Sketchware.
2. In main.xml add two Buttons button1 and button2, and a ListView listview2.


5. In MainActivity.java, add a Shared Preferences component sp:sp, a Dialog component dialog_add, and an Intent component i.

6. Add a Map variable map, three String variables jsondata, label and value, and a ListMap maplist.
7. In onCreate event use blocks to get data from shared preferences to maplist and display it in ListView.


9. Create a CustomView dialog_view.xml containing LinearLayout linear2 and linear3 for adding EditText fields created programmatically.

10. In the event button1 onClick (Add Button), use blocks to display a Custom Dialog Box which can be used to add data to the list.

The code in first add source directly block in the image above, creates two EditText programmatically, adds them to the LinearLayouts in CustomView dialog_view.xml, and sets the CustomView as the View of the Dialog.
final EditText dialog_edittext1 = new EditText(MainActivity.this);
dialog_edittext1.setLayoutParams(new LinearLayout.LayoutParams(LinearLayout.LayoutParams.MATCH_PARENT, LinearLayout.LayoutParams.WRAP_CONTENT));
dialog_edittext1.setHint("Text");
final EditText dialog_edittext2 = new EditText(MainActivity.this);
dialog_edittext2.setLayoutParams(new LinearLayout.LayoutParams(LinearLayout.LayoutParams.MATCH_PARENT, LinearLayout.LayoutParams.WRAP_CONTENT));
dialog_edittext2.setHint("Number");
dialog_edittext2.setInputType(InputType.TYPE_CLASS_NUMBER | InputType.TYPE_NUMBER_FLAG_DECIMAL | InputType.TYPE_NUMBER_FLAG_SIGNED);
View inflated_view = getLayoutInflater().inflate(R.layout.dialog_view, null);
LinearLayout dialog_linear1 = inflated_view.findViewById(R.id.linear2);
LinearLayout dialog_linear2 = inflated_view.findViewById(R.id.linear3);
dialog_linear1.addView(dialog_edittext1);
dialog_linear2.addView(dialog_edittext2);
dialog_add.setView(inflated_view);
The code used in second add source directly block in the image above, gets the data from EditText fields to the String variables.
label = dialog_edittext1.getText().toString();
value = dialog_edittext2.getText().toString();
11. Create a new View barchart.xml.
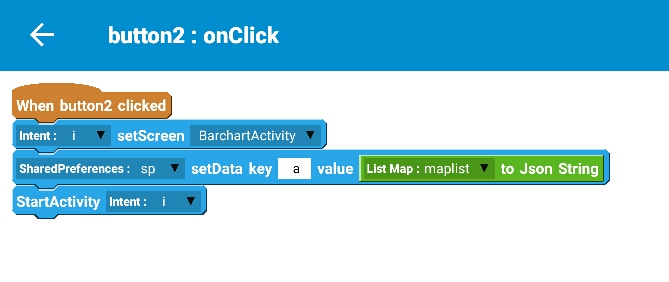
12. In the event button2 onClick in MainActivity.java, save the maplist to Shared Preferences and used Intent to move to BarchartActivity.java.
13. In barchart.xml add a LinearV linear1.
14. In BarchartActivity.java add a Shared Preferences component sp:sp, a Map variable map, and a ListMap listmap.
15. In onCreate event use blocks to get data from Shared Preferences to listmap, and codes to display this ListMap in BarChartView.

BarChartView chart = new BarChartView(this, listmap, "number", "text");
linear1.addView(chart);
Here 'text' and 'number' are the keys used to add items to List Map in MainActivity.java.
16. Create a More Block extra.

17. In the more block extra, use an add source directly block and put codes to define a View class BarChartView.
}
public class BarChartView extends View {
private int barCol;
private int progressCol;
private int progress=0;
private Paint myPaint;
private ArrayList<HashMap<String, Object>> list = new ArrayList<>();
private String numkey;
private String labelkey;
public BarChartView(Context context, ArrayList<HashMap<String, Object>> list, String numkey, String labelkey){
super(context);
myPaint = new Paint();
barCol = Color.BLACK;
progressCol = Color.RED;
progress = 0;
this.list = list;
this.numkey = numkey;
this.labelkey = labelkey;
}
@Override
protected void onDraw(Canvas canvas) {
int viewWidth = this.getMeasuredWidth();
int viewHeight = this.getMeasuredHeight();
myPaint.setStyle(android.graphics.Paint.Style.STROKE);
myPaint.setStrokeWidth(4);
myPaint.setColor(barCol);
canvas.drawLine(40, viewHeight -40, 40, 40, myPaint);
canvas.drawLine(40, viewHeight -40, viewWidth -20, viewHeight -40, myPaint);
int lastBase = 40;
int barWidth = (int)(viewWidth - 80)/list.size();
int max = Integer.valueOf(list.get(0).get(numkey).toString());
for (int i =0; i<list.size(); i++){
if(max < Integer.valueOf(list.get(i).get(numkey).toString())) {
max = Integer.valueOf(list.get(i).get(numkey).toString());
} }
int maxHeight = viewHeight - 120;
myPaint.setStyle(android.graphics.Paint.Style.FILL);
for (int i =0; i<list.size(); i++){
int col = 100+(155*i/list.size());
myPaint.setColor(Color.rgb(0, col, col));
canvas.drawRect(lastBase+10, viewHeight - (Integer.valueOf(list.get(i).get(numkey).toString())*maxHeight/max), lastBase + barWidth, viewHeight - 40, myPaint);
canvas.save();
canvas.rotate(270f, 0, 0);
myPaint.setColor(Color.BLACK); myPaint.setTextSize(barWidth/2); canvas.drawText(list.get(i).get(labelkey).toString() + " : " + list.get(i).get(numkey).toString(), -viewHeight +100, lastBase+10 +barWidth*2/3, myPaint);
canvas.restore();
lastBase = lastBase + barWidth;
}
}
This code only works for positive integer values and not for decimal values.
18. Save and Run the project.
Bar Chart form Json Array: https://www.sketchwarehelp.com/2019/02/bar-chart-from-json-array-in-sketchware.html?m=1
